BLOG
Visualize Graphs in Notebooks
We are excited to announce that you can now use Graphviz (opens in a new tab) to visualize directed and undirected graphs in RAI notebooks. Just provide node and edge relations, and the notebook will render the graph.
You can use attributes to determine the style and layout of the graph. Subgraphs allow finer grained control.
Input
A module (opens in a new tab) containing the following:
:node:a unary relation of identifiers (usually strings or integers) to use as node ids.:edge:a binary relation of edges as (from,to) pairs of node ids.
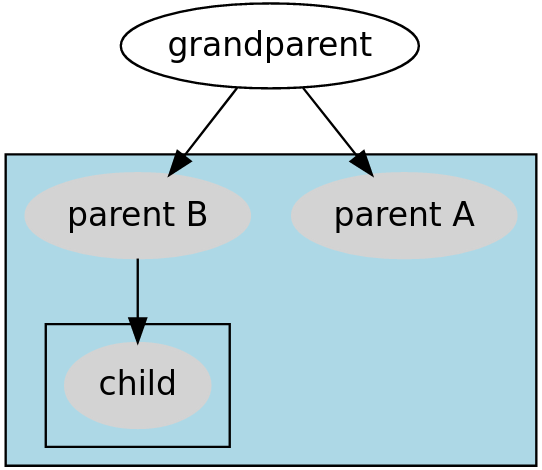
Here is an example, using a small family tree to generate a graph. We have defined the nodes and edges as below.
// read query

def nodes = "grandparent"

def edges = {
  ("grandparent", "parent A");
  ("grandparent", "parent B");
}

module attributes
    def node = "fontname", "Helvetica"
end

module subgraphs["parents"]
    def node = {"parent A"; "parent B"}
    def edge = "parent B", "child"

    module attribute
        def node = {("color", "lightgrey"); ("style", "filled")}
        def graph = "bgcolor", "lightblue"
    end
end

module subgraphs["children"]
    def parent = "parents"
    def node = "child"
end

module graph
    def node =  nodes
    def edge = edges
    def attribute = attributes
    def subgraph = subgraphs
end

def output = graphviz[graph]
When run in the RAI notebook, the following graph is generated:
Please refer to our Visualization Library (display) (opens in a new tab) for further information.