Representing Data Graphically with Vega and Vega-Lite

You can now represent RKGS data graphically in the RelationalAI console, by using the rich graphics available through Vega and Vega-Lite. Both formats use the JSON format (opens in a new tab) to describe visualizations such as bar charts, area charts, line charts, circular charts, scatter plots, and geographic maps. You can incorporate any valid Vega or Vega-Lite code directly into a cell. The results display directly in the RelationalAI console.
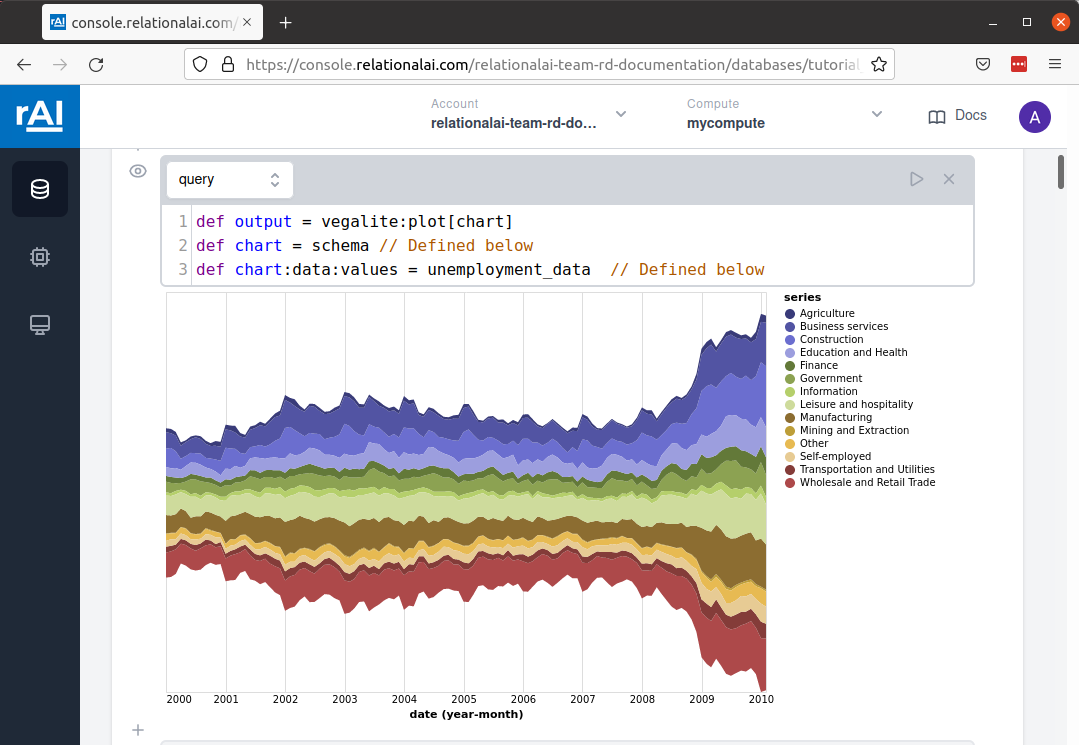
You can draw on the detailed examples of Vega (opens in a new tab) and Vega Lite (opens in a new tab) to begin representing data graphically within the RelationalAI console.
Related Posts

RelationalAI & Julia
At JuliaCon 2021 Huda Nassar gives an overview of what we do at RelationalAI, and highlights how we"ve used Julia to develop our RKGS and modeling language Rel.
Vectorized Query Evaluation in Julia
Modern databases can choose between two approaches to evaluating queries with high performance: Query Compilation compiles each query to optimized machine code, while Vectorization interprets queries using BLAS-style primitives.